Once you’ve finished taking a trace, the capture will automatically open. You can also open previously created .gfxtrace files using the File → Open toolbar item.
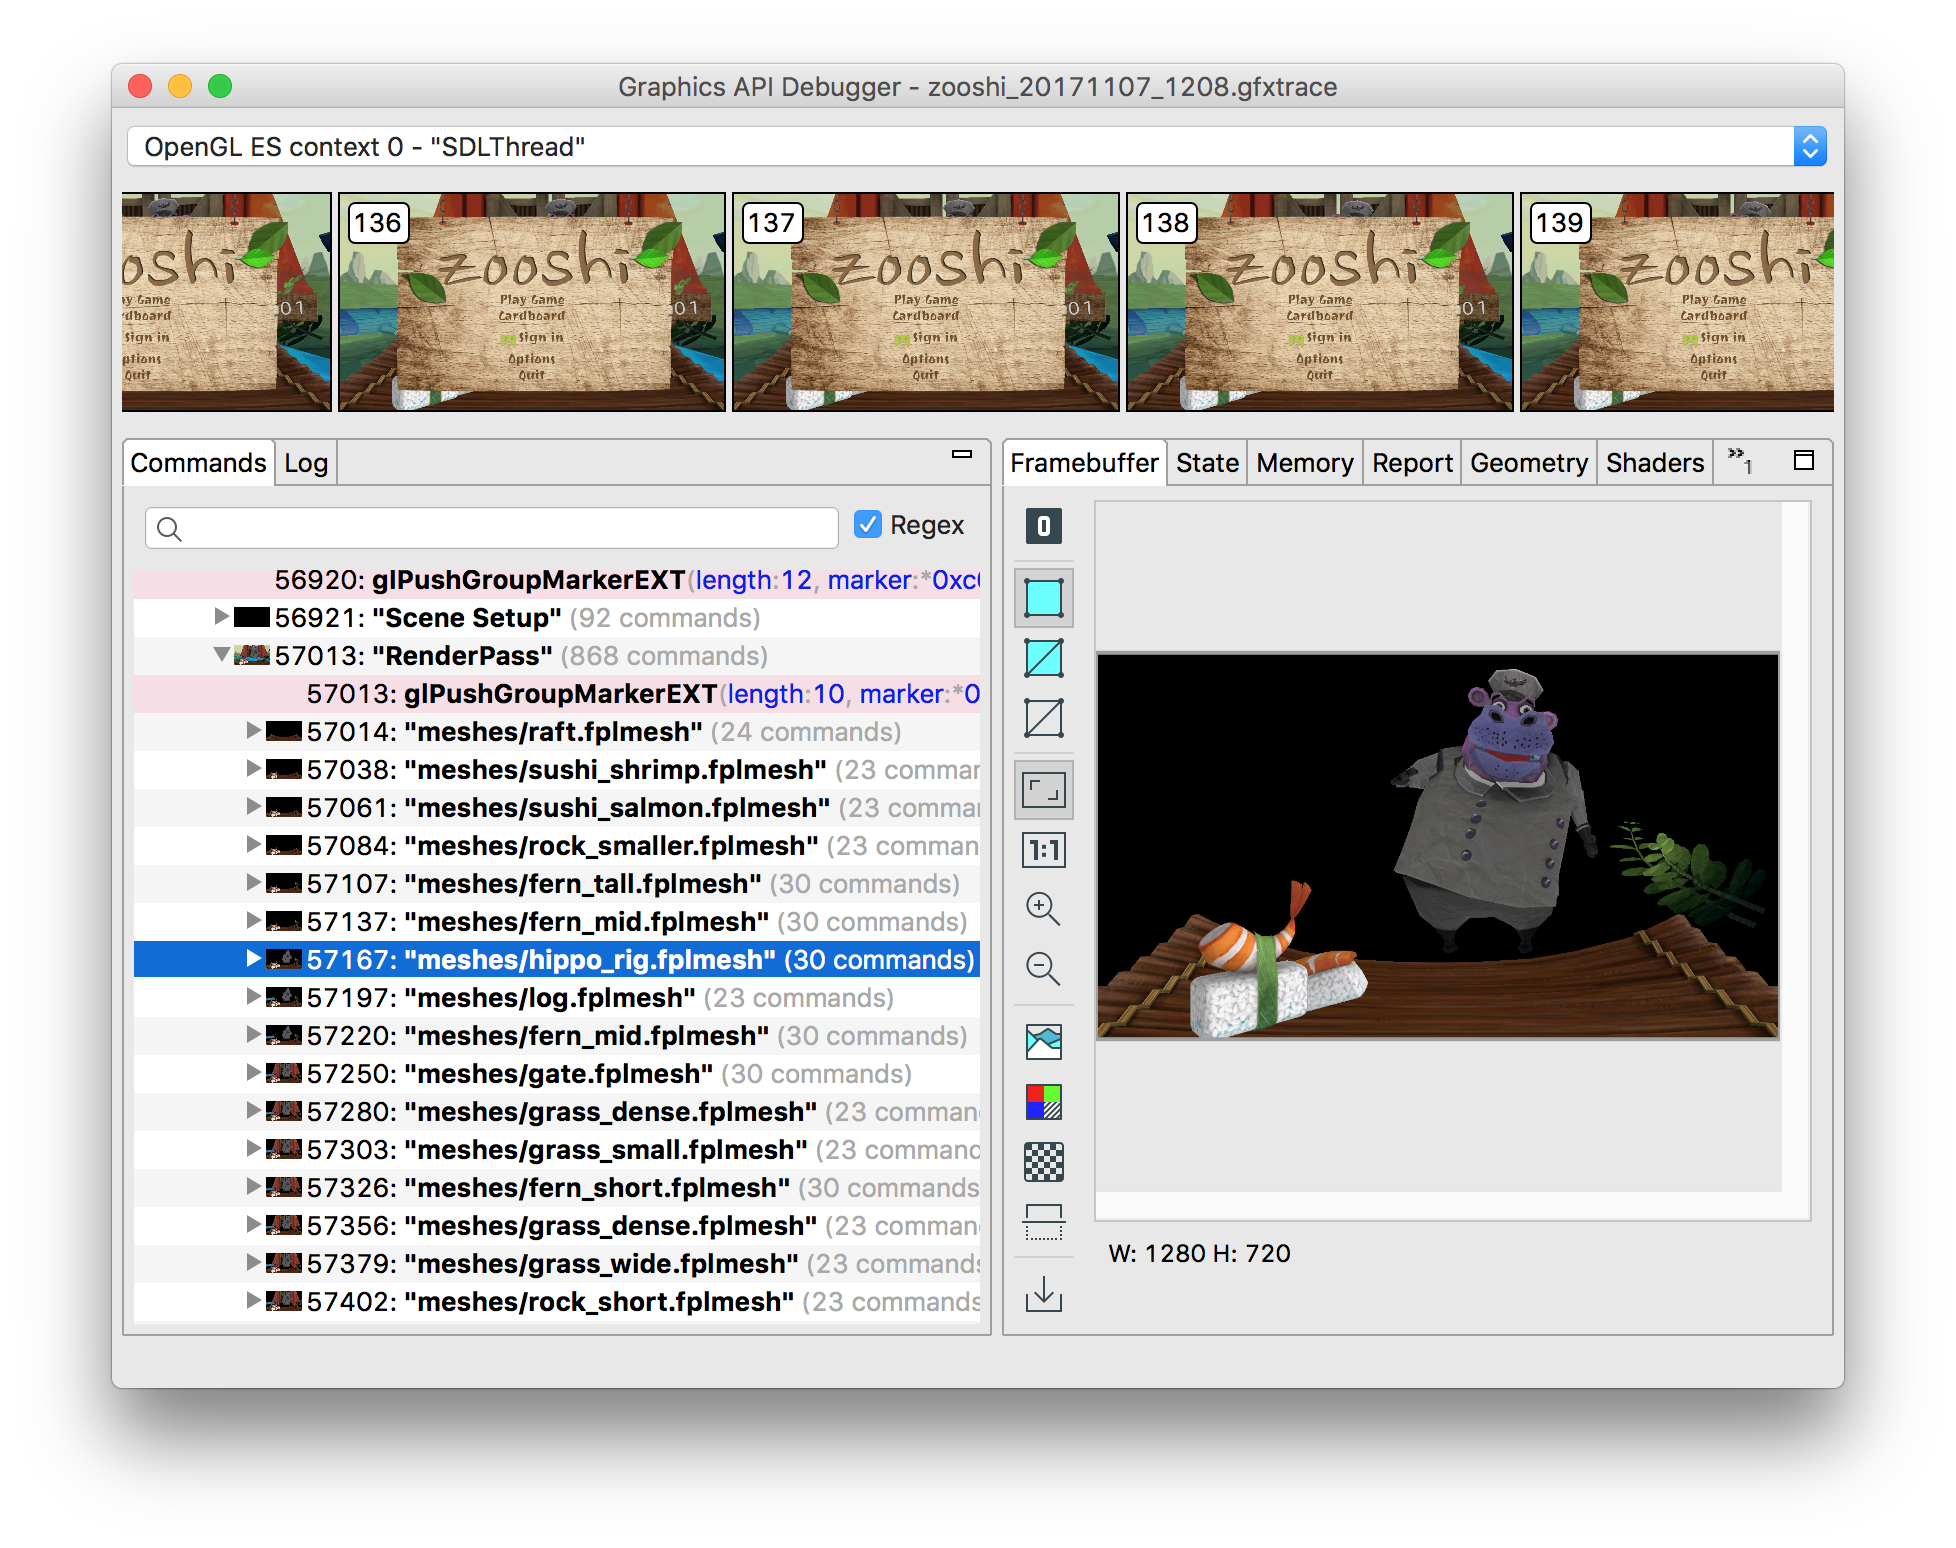
Upon opening a capture, you will be presented with the following window:
-
The top of the view contains a rendering context filter. By default all contexts are shown. By selecting a context the other panes will be filtered to just this selected context.
-
The film-strip view displays all the frames rendered in chronological order. Clicking on a frame will select that frame group.
-
On the left is the
Commandspane. This is a hierarchical view of all the commands recorded. Placing your cursor over the thumbnails of groups will show a larger preview image. -
On the right is the
Framebufferpane. This displays the contents of the currently bound framebuffer up to and including the selected command. -
Select other tabs to explore the graphical objects, state, and memory values associated with the frame.